| read the discalimer | How is a crossover made? | The phenomenon of induction | More than one inductor |
| The signal generator | The oscilloscope | The measurements | Excite L1 coil |
| ugly, ugly implications | Conclusions | . | . |
All trademarks mentioned and links are presented here for informational purposes only and to confirm statements made by the author. The author of these pages DOES NOT receive any remuneration from the mentioned brands and the listed links.
In any case if you decide to use the suggestions on this page you do so at your own risk. Repairing electronic equipments, even just opening it, can put your life at risk, so don't do it.
If you do not accept and/or not understand the statements in this disclaimer, written in blue, exit this page immediately.
Everything exposed in this web page is only a suggestion, probably you won't obtain the aim from you prefixed following it.
A true collector is looking for a) original items without any replaced parts, b) or if a Critical Restoration has been done that it is possible to go back to the original version. Lacking the previous 2 statements the object (not only for me) has a value of zero euros.
If you're interested in simulating an LC filter for crossovers, you're probably familiar with Renato Giussani's software packages, Bass-PC and Cross-PC. However, you may find this page useful, even though it is dedicated to microwaves (serious and dangerous stuff, unlike our toys).
To discuss the issue, we need any crossover, preferably one with 12 dB per octave.
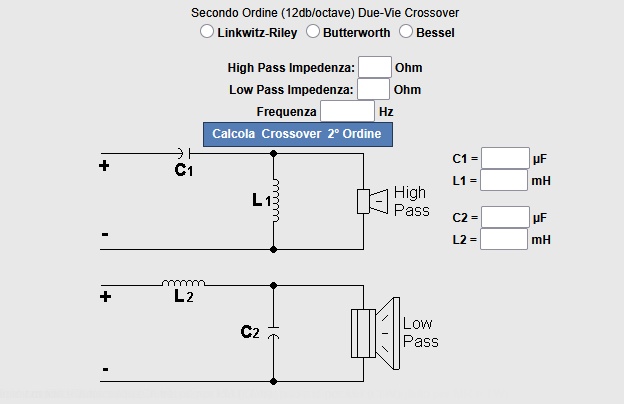 |
| Fig.1, from the website of a well-known speaker repairer, here is an example of a 12 dB per octave crossover with calculations (thanks) |
While assembling just four components seems easy, on another page, we discussed the problem of fixing the individual components in place because their relative position is important, too.
For example, if we add resistors, perhaps 10W ones, it does not seem a good idea to place them close to a non-polarized electrolytic capacitor.
On another page, we discussed printed circuit paths that are too small to handle the current we send to the speakers.
Are we going to rewrite the whole history of electromagnetic induction, from Michael Faraday to Joseph Henry, here?
I don't think so. We're only interested in the first figure that appears on Wikipedia. Thank you for describing the phenomenon so well!
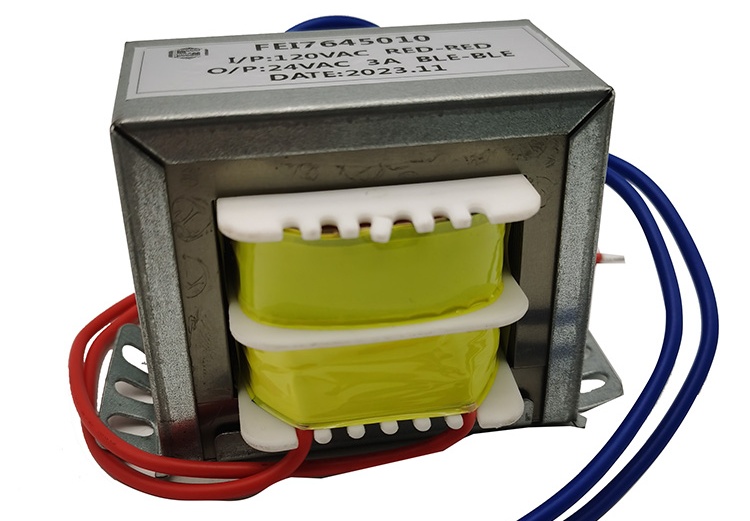 |
| Fig.2, an isolating transformer in which the two coils, isolated from each other, are clearly visible. Its functioning is based on the electromagnetic induction produced by the primary coil on the iron core, which in turn energises the secondary coil |
Apart from the case of a 6 dB per octave crossover, in all other cases there are at least two inductors, as in the examples below.
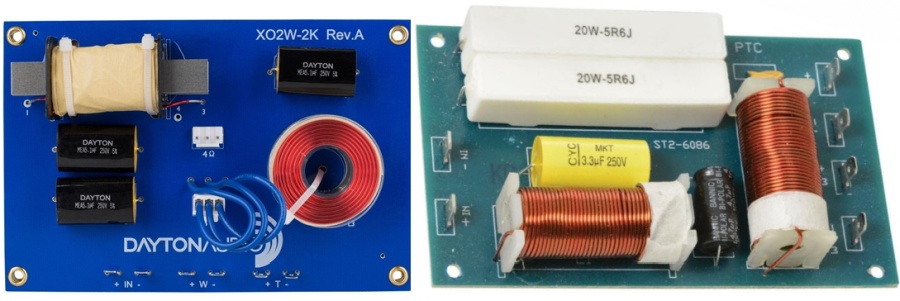 |
| Fig.3, two commercial crossovers with two inductors, we must immediately protest against the ridiculous/non-existent fixing system for all components. As for the positioning of the coils, however .... |
Let's take a midrange crossover, 12 dB per octave, simple without compensation or filters, like the one on Rod Elliott's website.
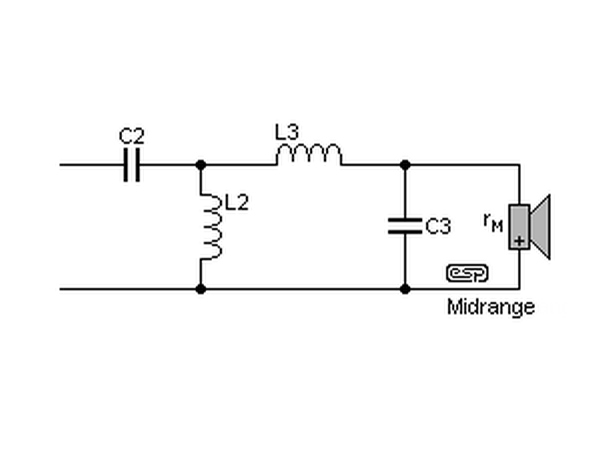 |
| Fig.4, To describe the problem, a typical crossover such as the one shown in the figure is sufficient |
We will use the diagram in Fig. 4 to connect the instruments and simulate the measurements.
The generator is problematic. The inductors in the crossovers are simply copper wire with a decent diameter that is wound in a spiral. Often, when measured in DC, they show a resistance ranging from 0.1 to 5 ohms. The signal generator should be able to work with such low resistances.
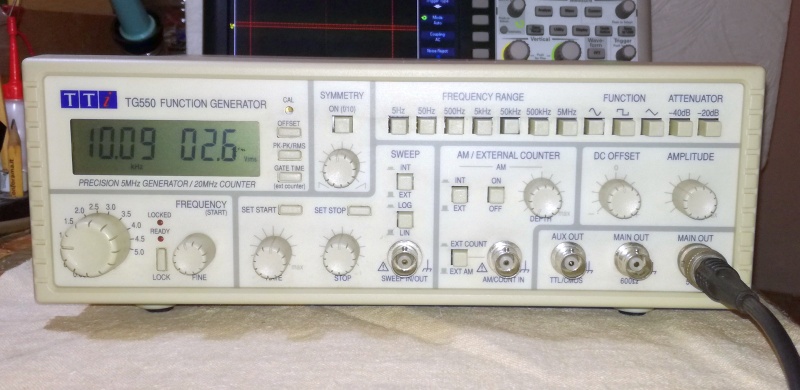 |
| Fig.5, a high-quality generator with an output impedance of 50 ohms (and also 600 ohms) but capable of operating even on low loads down to 10 ohms with fine adjustment of frequency and amplitude |
As we know, inductors operate in alternating current and are usually measured using a 1.0 KHz signal in audio applications.
A trick to further stimulate mutual induction and increase the impedance seen by the generator is to use a 10 KHz signal.
Any oscilloscope will do, especially if it only needs to display 10KHz. However, if you want to create a table, which we will see later, showing all mutual inductions, you need numerical results for the frequency and amplitude of the measured signal, which usually only a DSO can provide.
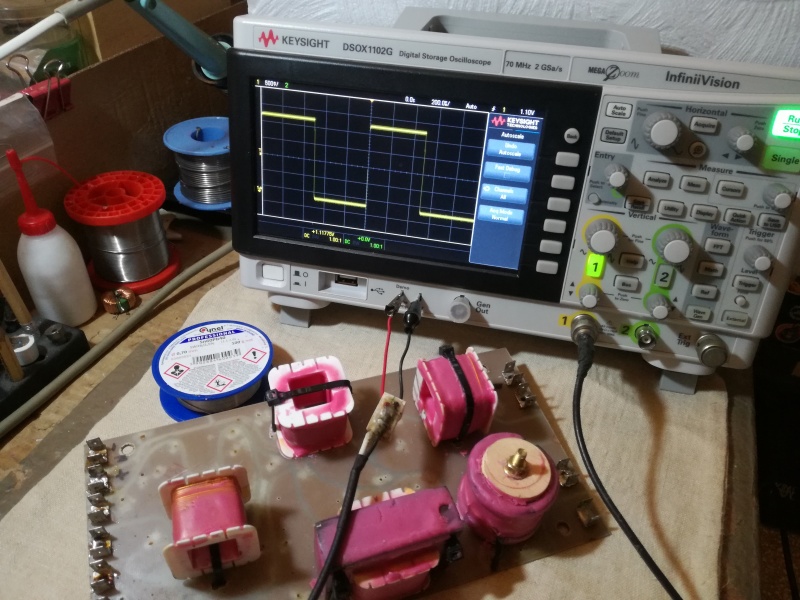 |
| Fig.6, with a good quality oscilloscope, we use the X1 probe and launch the probe's auto-calibration in Hz and mV. At the bottom, we can also see the 5 inductors that we are going to measure |
It is best not to use sound cards converted into oscilloscopes by some software, apart from the fact that 96KHz sampling is not sufficient to measure 10KHz, but at least 192KHz is required (DO NOT mention Nyquist to me). Frequency and voltage measurements are not calibrated and reproducible, there is too much interference (perhaps from the computer itself) and it is also easy to create ground loops.
In Fig. 6, we see a crossover with only the inductors mounted in their original position, without the other components. Below is a simplified diagram.
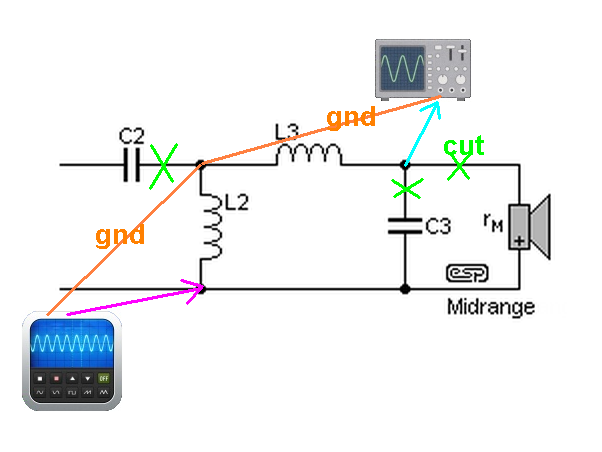 |
| Fig.7, the disconnections to be made in order to isolate only the coils that remain in their original physical position are shown in green. The other connections are discussed in the text |
In the figure, L2 and L3 have a common connection (as is often the case), so care must be taken to connect the generator and oscilloscope grounds together (orange colour) as shown in the figure.
If there is no connection between the coils, the position of the ground and the probe must be chosen to obtain the widest signal.
The purple line shows the 10KHz signal from the generator, which produces electromagnetic induction in coil L2, and the light blue line shows the measurement of the voltage induced in coil L3.
Build connections
To facilitate the measurements, we add connecting wires to the ends of each coil of the crossover in Fig.6.
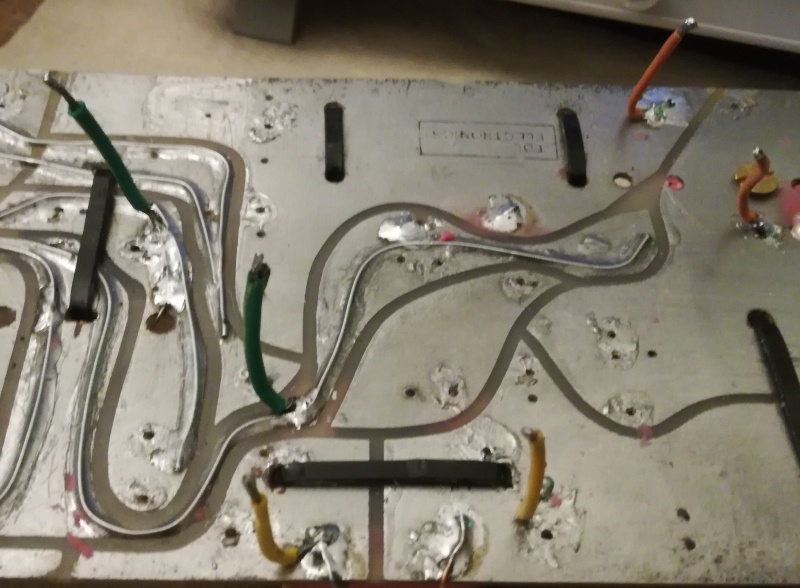 |
| Fig.8, the colours of the wires help us identify the coils to be measured |
A little tip: to obtain accurate measurements, switch on the measuring instruments at least half an hour beforehand (as recommended by Tektronix and Agilent).
We connect the generator, set to 10KHz and 2.5V RMS, to L1 and measure the actual signal on the coil with the oscilloscope.
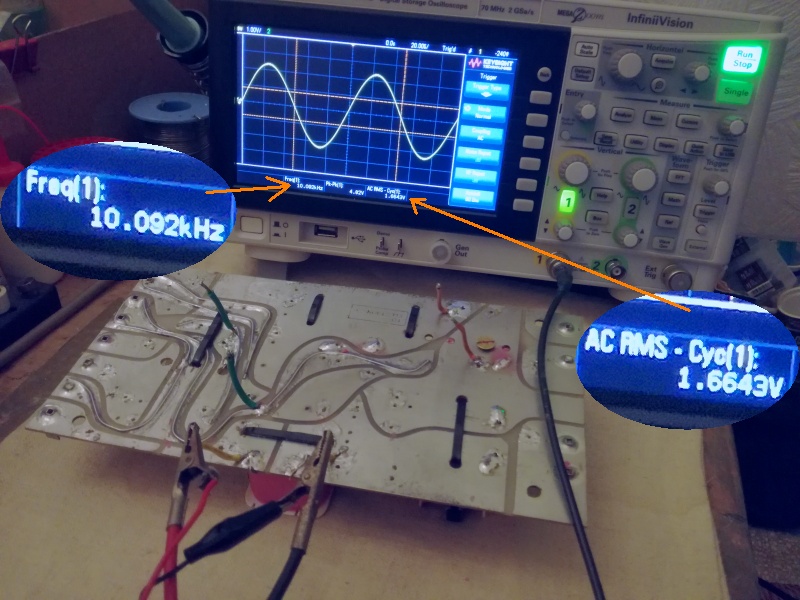 |
| Fig.9, we measure the voltage across L1, which is approximately 10kHz and 1.6643 Vac RMS |
Measuring frequency is really important because it will tell us whether the inductance is suffering from electromagnetic induction from its neighbour or whether it is picking up some other induction (radio signal, WiFi, HF emissions from a switching device, 50Hz mains, etc.).
Measuring L2, L3 etc.
We have already mentioned Wikipedia and a nice diagram showing mutual induction. Let's do the same by measuring the voltage induced on the other coils.
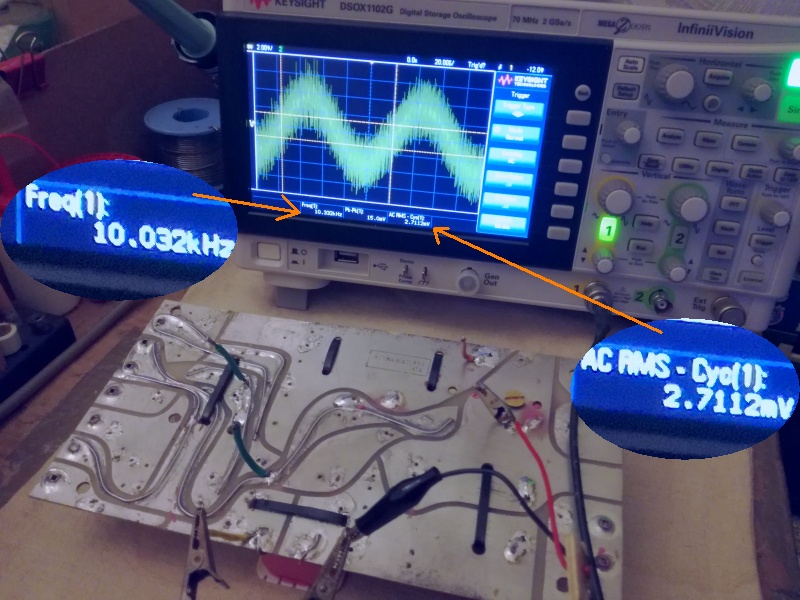 |
| Fig.10, induced voltage on L2, approximately 10KHz and 2.7112 mV, we notice a recognisable signal but very low in V compared to that present on L1 |
It would be sufficient to compare the waveforms for a qualitative assessment, but if we then move the coils for a better result, we need a quantitative assessment.
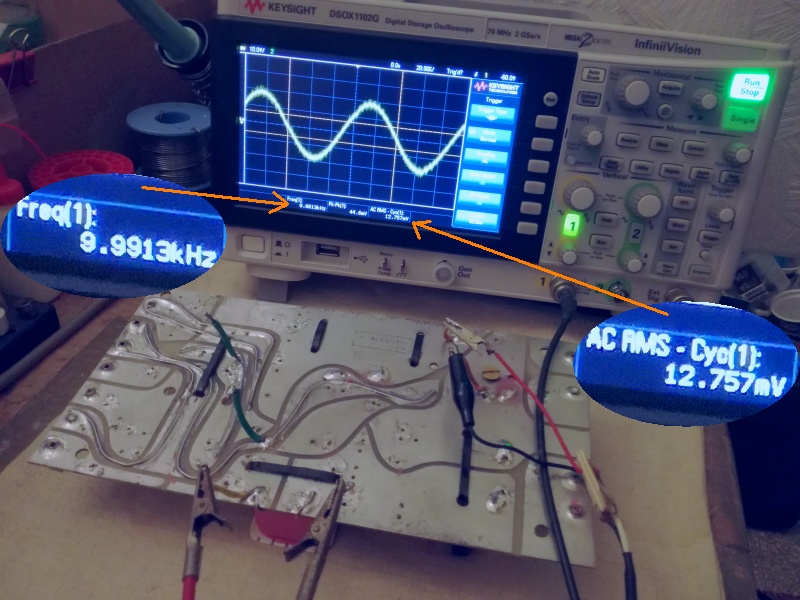 |
| Fig.11, voltage induced on L3, approximately 10KHz and 12.757 mV with a signal that is clearly recognisable this time |
We go from 2.7mV induced on L2 to a value 10 times greater, 12.7mV induced on L3. We measure the other coil.
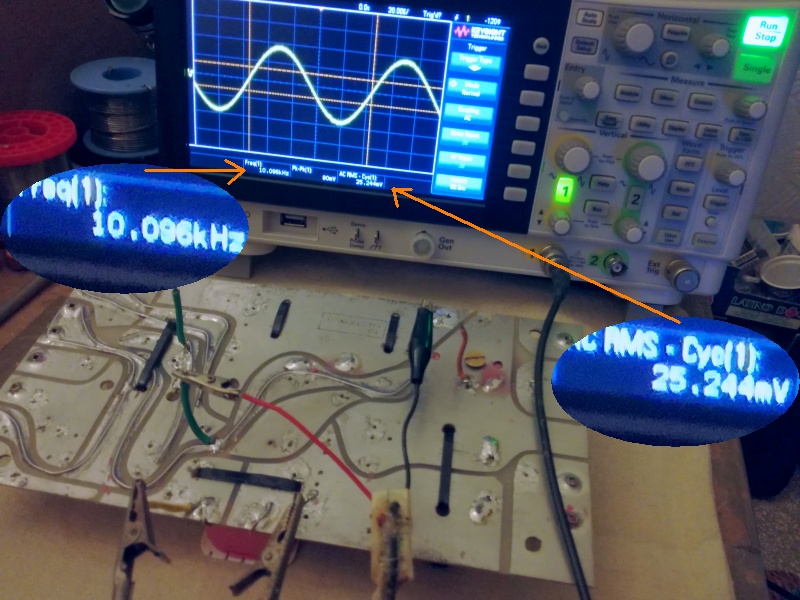 |
| Fig.12, voltage induced on L4, approximately 10KHz but 25.244 mV, even greater than that on L3 |
We measure a value on L4 that is approximately double that of L3. Now we only need to measure L5.
Then we need to:
You will obtain two measured values for each coil: one by powering L2 and measuring L3, and one by powering L3 and measuring L2. These values should coincide, except for measurement errors.
| Volts | L1 | L2 | L3 | L4 | L5 |
| L1 | 1.6643 | . | . | . | . |
| L2 | 0.0027112 | ? | . | . | . |
| L3 | 0.012757 | . | ? | . | . |
| L4 | 0.025244 | . | . | ? | . |
| L5 | 0.010973 | . | . | . | ? |
We can now calculate the table of mutual induction percentages, which is more explanatory than the previous one.
| % | L1 | L2 | L3 | L4 | L5 |
| L1 | 1 | . | . | . | . |
| L2 | 0.163 | 1 | . | . | . |
| L3 | 0.766 | . | 1 | . | . |
| L4 | 1.517 | . | . | 1 | . |
| L5 | 0.659 | . | . | . | 1 |
Empirically, values should not exceed 1% up to a maximum of 2%. In our case, the interaction values are low, only L1 towards L4 gives us some concern.
Now, with this table, we can reorient the coils by rotating them on their axis, or space them out, or rotate them on the X-Y-Z axes.
Unfortunately, ugly, ugly implications
With just the crossover and its coils only, we can turn off and disconnect the generator, connecting the oscilloscope to a single coil and using the AutoScale function to see what happens.
The coil picks up electromagnetic interference from the environment. The Volt values depend on the coil's type and Henry value. Now, try turning off some lamps, moving the oscilloscope as far away as possible, turning off the Wi-Fi and disconnecting smartphone power supplies, end so on.
If your expensive oscilloscope can be powered by batteries, try turning off your home's main switch and see what your coil picks up. But be careful if you use a 12Vdc-230Vac inverter, it must not damage the oscilloscope or cause other interference.
We have certainly discovered another problem. Who knows why so many crossovers designed by audio geniuses are inside metal boxes (the first Tannoys, the first JBLs, Electro Voice, etc.).
Using a signal generator and a digital storage oscilloscope (DSO), we have developed a powerful method for enhancing the performance of an audio crossover.
And on another of my web pages, we discovered that even the capacitors used in crossovers pick up interference. Never a joy :-).
| In the last years at Universita' Degli Studi di Roma La Sapienza |
Dr. G. Visco already contract professor for Chemistry in Environment & Cultural Heritage into ---------> |
Laurea Degree Course of Sciences Applied to Cultural Heritage for Diagnostic and for Conservation |