|
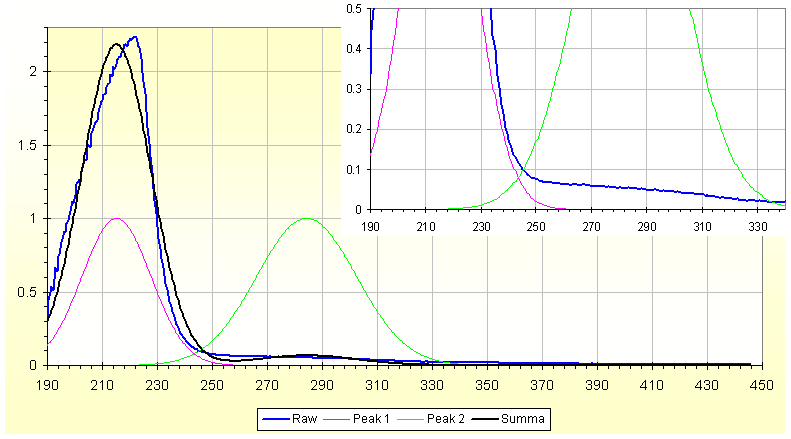
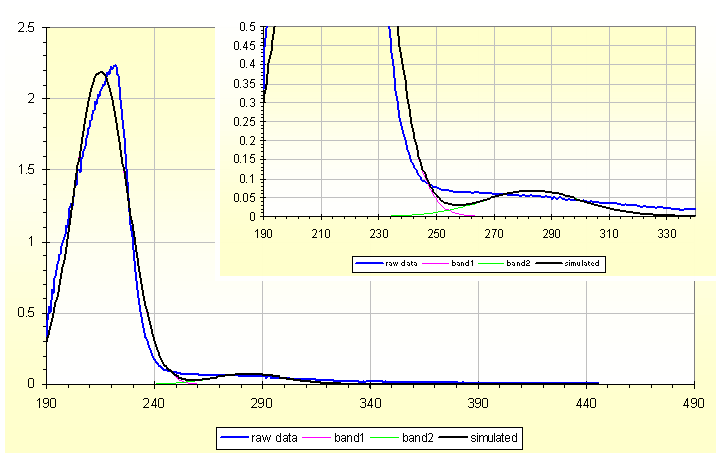
| Fig.1, UV-Vis spectra, example of deconvolution of 2 overlap peaks, using this software |
Speaking about "peaks" is better use a common description, please read the following HPLC-GC troubleshooting before continue.
With this small piece of software we do not like to solve all of previous problems, but only to find the 2 or 3 peaks able to produce a shape as in fig.1.
One of the first applications of Chemometrics was the resolution of peaks overlap; today we have Parafac, Paralind, MCR and sometime PLS used for this. But this is too complex for my students as a first time approach.
Also there are a lot of routine for Matlab/Octave or for "R" devoted to peaks deconvolution. But it is still difficult for my students to grasp all parameters used in those routine and often the subtended errors.
Accounting all I said previously, I select Excel to deconvolute peak. It is not a new idea and you can be inspired reading the following:
In the Fig.1 you can see the blue line, the raw data. The main peak probably ended at 250nm but another peak appears up to 370nm. This is a typical spectrum of water coming from the lake or river, using Suprasil cuvette with path length of 10mm.
Is better to spent some time on the blue spectrum:
Avoiding confusion we are doing a Curve Deconvolution, we found 2 or more peaks hidden under the Curve. Curve Fitting is a different mathematical work, finding a simple or complex equation able to describe the curve and able to minimize the distance among measured points and to obtaine the equation. To make a tentative of Deconvolution we must do more and more simplifications as:
For the point a) some researchers suggest the use of the Normal, Gaussian distribution as first step, and as an alternative the use of the Lorentz distribution (the type is linked with the detector of the instrument).
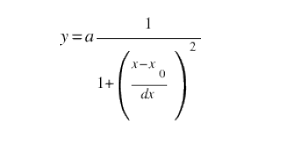  |
| Fig.2, on the left the Lorentz formula, the Gauss formula on the right. With: a=amplitude, dx=width HWHM, x0=maximum value |
For iterative calculation we can use Solver. Describe Solver is completely out of the scope of this page, if you are not a spreadsheet's wizard leave out this page immediately.
Solver is available in Libre Office, Open Office and MS Office. Only to obtain compatibility we use Excel 2003 with standard Solver. There is a free GPL version of Solver named OpenSolver (it exists SolverStudio, free, but they use rather more commercial routines).
If you like to know more on Solver use the links in this OpenSolver web page.
To understand the calculation inside this software is better know something about LINEST function (see at Colby college, and on MS support), on the use of NORMDIST (on MS support, and on ExcelUser).
This free software was distributed under Creative Commons Public License, CCPL 3.0, see my Copyright web page. Please read accurately the Liability Waiver in red.
There are a few different versions, all work on MS-Excel 2000, up to MS-Excel 2003, some was tested on MS-Excel 2007 and 2010 version. All files are in .ZIP format to reduce size, available:
Dear students, this is not a course on Excel so you must already know how to use formulae and functions. I remember you to pass every lesson for Excel in this Course, please pass all lessons (and do ALL projects).
To learn how to use is better download first the .ZIP file with some simulated curve (697 KB) and some real spectra.
Very often the writer of a software is not the best writer of "instructions", he/she already know how to use! But I make here a tentative to describe how to use:
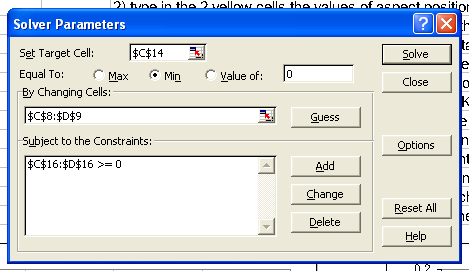 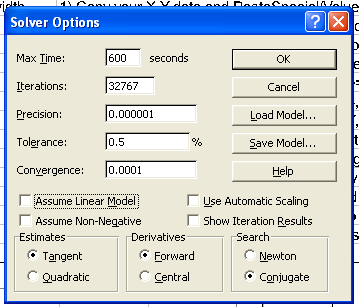 |
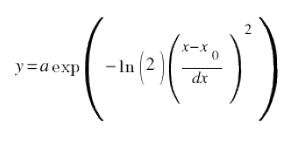
| Fig.3, the Solver parameter on the left with pointing cells, and the Solver options on the right |
 |
| Fig.4, the Solver results, click only on OK to accept |
Having a result is better change a little the starting values (from C8 to D9). Write in a paper the results, change C8..D9 and restart Solver, write results.
Do it for 3 or 5 times and probably obtain a better model, The starting point are very important, more in 3 peaks deconvolutions.
The simple example is in the file 2-simulated-peaks.XLS with a simulated spectra with peaks at 300nm and 600nm. Can be solved with 2 Gauss method. Be careful, must be enlarged the space for dataset in the main .xls file, from 512 to 574 values.
One other example is in the water-spectra.xls file. It is an hard work, the 'human' see the second peaks, probably broad, at about 270 nm, but can the model find it?
As previous stated the main peak is heavy distorted by instrument saturation so find the first solution is difficult also. One other problem is the left side of the main peak, missing!
Please open the GVisco_deconvoltution1.12_2Gauss.xls file, open also the water-spectra.xls file. Copy the 2 columns from water-spectra and PasteSpecial/Text in the "raw" sheet.
To first step I suggest the values of 220 and 270 for posistion and 10, 20 for width. Run Solver with previous show parameters.
 |
| Fig.5, a Gauss solution for water-spectra.xls, with 215 and 284 nm |
One other possible solution is 215, 281 for position and 2.184, 0.068 for height. But find other yourself.
There are other excel files as example, one is the file IC-chromatog.XLS inside very interesting are the sheet "brwash2or" with 2 peaks at, about, 177sec and 210sec. In the same file there is the sheet "wash_pulp" with 3 peaks at about 176, 188, 199 seconds.
One other example is in the file chm-150.XLS, it come from a laboratory excercise of Prof. James B. Foresman with title "CHM 150: Computers in Chemistry Seminar". This example is more complex, you must first remove the negative values on baseline (probably with the use of our software on scaling) and after define the 2 probably vaules of nanometers for the peaks on the left of the spectra.
Tips
If you know Excel you can expand or reduce the 512 rows, and probably can desing a solution for 4 peaks, but this one other history.
Donations if you have a Bitcoin wallet
If you have a nice fat wallet you can send a few cents to this code 1ETv1mJTZTB7EiXwZkucF2BTA512Rkaw6 maybe with a message (be careful to the transaction cost, send 0.1 and pay 0.01 is not a good idea).
1ETv1mJTZTB7EiXwZkucF2BTA512Rkaw6 <== my code , Thank you.
Donations if you have not a Bitcoin wallet
If you like this work and measures you can make a small donation of Bitcoin. You do not need a wallet to make a donation, indeed even those who have Bitcoin wallet is better to pass for a web site that "gift" currency since this does not have a transaction cost.
To make a donation you must use some of your web-time. Go to www.GreenBitCo.in, enter my code 1ETv1mJTZTB7EiXwZkucF2BTA512Rkaw6 enter the Captcha code that you see, press "Claim Now" button. Wait 15 minutes on the publicity page, when the 15 minutes pass fill the new Captcha and press "Claim Now" again. To get some value are necessary 10 pages or more. Be careful, do not use roulette, dices, casino and other stealing web site.
1ETv1mJTZTB7EiXwZkucF2BTA512Rkaw6 <== my code , Thank you.
| Universita' Degli Studi di Roma La Sapienza |
Dr. G. Visco appointed professor for chemometrics & .... |
Corso di Laurea in: Scienze Applicate ai Beni Culturali ed alla Diagnostica per la loro Conservazione |