|
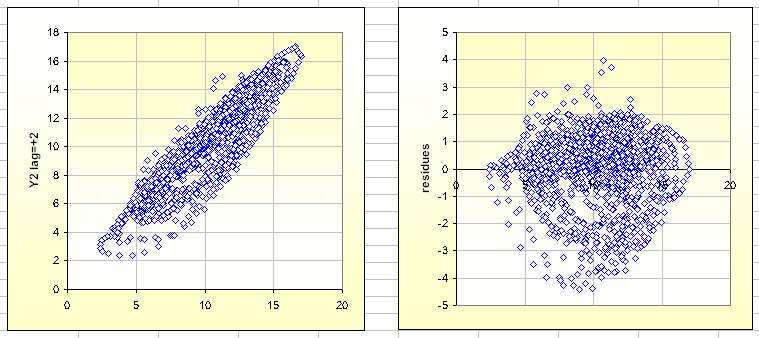
| Fig.1, results after moving the 2nd data set 2 steps forward, the correlation on left, the residues on right |
Copying from Wikipedia: Early work in time-frequency analysis can be seen in the Haar wavelets (1909) of Alfréd Haar, though these were not significantly applied to signal processing. More substantial work was undertaken by Dennis Gabor, such as Gabor atoms (1947), an early form of wavelets, and the Gabor transform, a modified short-time Fourier transform. The Wigner-Ville distribution (Ville 1948, in a signal processing context) was another foundational step.
With this small piece of software we do not like to solve all problems of correlation between 2 distributions but only make a tentative to produce a Lag-Plot (or lag correlation) of your data. Please do not confuse with Correlogram and with Scaled Correlation.
In Fig.1 you can see the scatterlplot between 2 distributions after 2 steps forward; on the right the residues of regression, very useful to check "the quality" of obtained values from correlation's formulae.
Accounting all I said previously, I select Excel for Horizontal Shifting. It is not a new idea and you can be inspired reading the following:
The idea of this software comes from many of us work in the spectrophotometric UV-Vis field. Several times the replicate of the same solution produce a slight different spectra.
Accepting a little difference in absorbance, we aspect the same value in nanometre, for the centre of absorbance band. Plotting 3 replicate we can find a difference of one step (0.5nm) in the centre values! And sometime not.
So I have started the design of a simple spreadsheet to move the second distribution 4 steps forward and backward and every time calculates the Pearson correlation.
It is better to spent some time on the procedure:
Avoiding confusion we are doing a procedure as shown in Fig.2. In column Y1 the 1st distribution, is fixed, in column Y2 and following the 2nd distribution moved one cell up and down (one lambda step of spectrometer, as example).
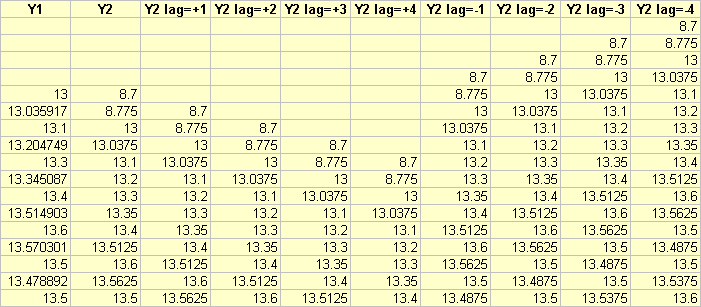 |
| Fig.2, the second distribution is moved forward and backward before calculation |
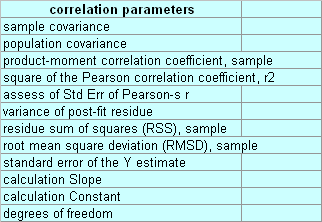 |
| Fig.3, the calculated parameters for regression |
This free software was distributed under Creative Commons Public License, CCPL 3.0, see my Copyright web page. Please read accurately the Liability Waiver in red.
There are a 2 different versions, all work on MS-Excel 2000, up to MS-Excel 2003, and was tested on MS-Excel 2007 and 2010 version. All files are in native .XLS format, available:
In the Fig.3, on the right, are shown the regression parameters calculated by software, the "errors" are useful to estimate the quality of correlation.
Dear students, this is not a course on Excel so you should already know how to use formulae and functions. I remember you to pass every lesson for Excel 2003 in this Course, and after that, pass all lessons of 2010 version (and do ALL projects).
Very often the writer of a software is not the best writer of "instructions", he/she already knows how to use it! But I have made here a tentative to describe how to proceed:
The best example, up to today, is the file sources.XLS with the columns B and C correlated with a lag, and with the other column with practically no correlation.
We are working to fill the file sources.XLS with some other examples coming from UV-VIS or NIR spectra, wait please.
Tips
If you know Excel you can expand or reduce the 1500 rows, and you can probably design a better "autoload" solution. But remember the Copyright on these files.
Donations if you have a Bitcoin wallet
If you have a nice fat wallet you can send a few cents to this code 1ETv1mJTZTB7EiXwZkucF2BTA512Rkaw6 maybe with a message (be careful to the transaction cost, send 0.1 and pay 0.01 is not a good idea).
1ETv1mJTZTB7EiXwZkucF2BTA512Rkaw6 <== my code , Thank you.
Donations if you have not a Bitcoin wallet
If you like this work and measures you can make a small donation of Bitcoin. You do not need a wallet to make a donation, indeed even those who have Bitcoin wallet is better to pass for a web site that "gift" currency since this does not have a transaction cost.
To make a donation you must use some of your web-time. Go to www.GreenBitCo.in, enter my code 1ETv1mJTZTB7EiXwZkucF2BTA512Rkaw6 enter the Captcha code that you see, press "Claim Now" button. Wait 15 minutes on the publicity page, when the 15 minutes pass fill the new Captcha and press "Claim Now" again. To get some value are necessary 10 pages or more. Be careful, do not use roulette, dices, casino and other stealing web site.
1ETv1mJTZTB7EiXwZkucF2BTA512Rkaw6 <== my code , Thank you.
| Universita' Degli Studi di Roma La Sapienza |
Dr. G. Visco appointed professor for chemometrics & .... |
Corso di Laurea in: Scienze Applicate ai Beni Culturali ed alla Diagnostica per la loro Conservazione |