Color Profile across a segment, or, Color Transition moving along a line,
in your photo of stains or drops (with Excel)
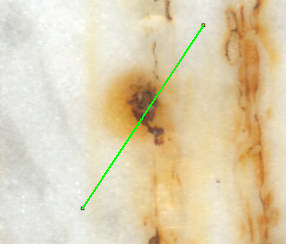 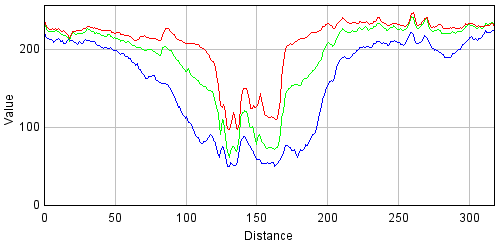 |
| Fig.1, on the left a stain, a splash on a surface; on the right a measure of the colours |
History
First, this is not a software for ICC profile for color management of your printer or monitor. The ICC Color Profiles describes the color attributed to a particular device or viewing requirement by defining a mapping between the device source or target color space. If you need to know more, see this pdf (244 KB).
Having a stain, on a surface, we can digitalize and with a free software obtain a color profile across a line (someone call this Line Profile RGB Analysis). This is more important for Cultural Finds to monitoring the progress of degradation, or better to measure the cleaning.
In Fig.1 it is shown the problem, on the left the stain and on the right the chart produced by one of the software cited below.
- thanks to San Diego State University; the better description of the problem Intensity Profile of Matlab with example's chart,
- also from San Diego State University; a very small Glossary on terms used,
- from M. Benallal, J. Meunier; a paper of 2003 on Real-time color segmentation of road signs (414 KB) describing exactly "the RGB profile of a line (identified with the white arrows) drawn across a STOP sign shows the 'nearly' primary nature of the sign color with the red component being much higher than the two other ones",
- from University of Chicago; a description of use of Plot-Profile command, in ImageJ, read the file Basic Intensity Quantification with ImageJ (560 KB),
- from Dresden School for Biomedicine; a long file on Basics of Quantitative Image Analysis (8.7 MB), this is what you really need to know about 'Image Processing' .... but never thought to ask,
- from a producer of good microscope; the description of the Digital Sight ACT-1 software. At the end of this page do see the description of Line Profile function,
- of course from Matlab/Octave; a good example of Pixel-value cross-sections along line segments,
- .
- the main web site of ImageJ software 1.xx, with documentation, help, plug-ins and binary downloads,
- only as a suggestion, another free software for image analysis, ICY: an open community platform for bioimage informatics,
There are cited above routines for Matlab/Octave and for "R" devoted to solve this problem. But it is still difficult for my students to grasp all parameters used in those routines and often the subtended errors.
Accounting all I said previously, I have selected one other time Excel to better calculate the profile, see the software section.

Inside the Problem
In the Fig.2 you can see an ancient paper with foxing, on the left the paper as-is, on the middle the paper cleaned with the method B, and on the right the same paper is cleaned with method A.
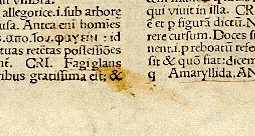 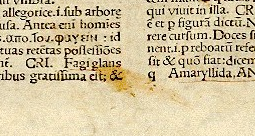  |
| Fig.2, on the left the paper as is, on the middle the cleaning method B, on the right the cleaning method A |
In studies on Cultural Heritage it is necessary to measure more accurately the progress of degradation. On the other hand, the restoration (cleaning in our case) needs a more accurate measuring system which allows to not completely remove the degradation but only to stop its progress and permit a good readability at work.
The idea is to use digitalisation of the surface and some free software to calculate the RGB profile along a line. The line was draw starting on a "clean" zone of the sample, passed through the mark and ending in the opposite "clean" zone.
Strarting from a RGB digitalisation one of the problems is obtaining an accurate Black & White profile. This software solves, partially, with an external computation by a plugin and with an internal elaboration. Another problem is finding a "true white" point across the line to make the white balance, this is an operator's problem.
We need, probably, the following:
- the photo: to digitalize the sample we must used a method more than reproducible. Probably a photo chamber is not sufficient, the illuminance, the position, the focal length, the exposition must be the same or the difference after and before cleaning can not be measured,
- a scanner: an idea is to use a top quality scanner (not in resolution but in color accuracy). The scanners have other problems as different light in different points of glass, a break-in problem after switch on. A solution is to cut a black mask to cover all the glass with a hole for the sample. The position of the hole must be evaluate for every scanner, and this check overcomes the break-in problem,
- the DPI: every scanner has a mechanical resolution and a more larger digital/interpolate resolution. Is better to use DPI value up to mechanical resolution. Probably is not necessary a high DPI, larger produce Moiré effect and noise to measure stains and mask. Every sample has a better DPI setting, please do few tests to select it,
- the line: the line used to produce the profile must be the same on the different photo of the sample. On the sample can be cut 2 holes with a needle, or with a drop of ink. Alternatively we can produce a graphic layer to be fused, transparent, over the photo; but produce a digitalization with scanner in the same position and same width/height after a week is difficult. A better way is finding 2 points, with a digital zoom, already present in the sample, 2 characters in the paper, a crack in the marble or a similar one
- almost 5: in this image analysis the reproducibility is essential. To check the researcher must do almost 5 digitalisations of the object (removing and remounting on the scanner!), and then, on the 5 photos draw the line and produce 5 RGB profile. So it is possible to evaluate the reproducibility of the measure chain,
- software version: only after a lot of work on point IV, as above, we can check if different versions of the software for image analysis or different plug-in produces the same values. Please check more the driver of the scanner. An idea is not change the versions through the measures project,
- no ICC profile: is better not to use, or disable, every color management profile for the scanner, for the monitor, for the printer. Sometime the ICC profile can be non linear and can change the gamut of the instrument.
The Software
This free software was distributed under Creative Commons Public License, CCPL 3.0, see my Copyright web page. Please read accurately the Liability Waiver in red.
There is only one version working on MS-Excel 2000, up to MS-Excel 2003, was tested on MS-Excel 2007 and 2010 version. Are available:
How To Use
Dear students, this is not a course on Excel so you should already know how to use formulae and functions. I remember you to pass every lesson for Excel 2003 in this Course, and after that, pass all lessons of 2010 version (and do ALL projects).
Very often the writer of the software is not the best writer of "instructions", he/she already knows how to use it! Nevertheless, I have made here a tentative to describe how proceed:
- first download and install the Imagej software, version 1.xx, for image analysis,
- after download and install the Color Profiler plugin,
- the digitalisation of the sample was done before and the image must be open with ImageJ,
- in the image use Straight button to draw a line from a white zone, crossing the stain and ending on the opposite white zone,
- download the GVisco_color-profile-transition-1.31.xls file and open in Excel. The spreadsheet is already filled with an example,
- more, extended, instruction are inside the spreadsheet(s),
- use the Analyze -> Plot Profile -> Copy (of ImageJ) and paste in "raw" sheet from A9 cell,
- use the Analyze -> Tools -> Color Profiler -> Copy (of ImageJ) and paste in "raw" sheet from C9 cell,
- check if the column A and column C having the same number of rows. If not you find a probably bug in plugin. To solve use a new, temporary, sheet to copy the RGB (color..) and B&W, (plot..) profiles and after removing the first row of B&W profile, you can solve coping the aligned values to "raw" sheet. Remove the temporary sheet,
- in the Fig.3 there is a screenshot of the work, in upper right ImageJ, the photo with the straight line on the right, on the left there is the plugin with Black&White profile, and the plugin with RGB profile underneath. See the Copy and Save buttons in plugins windows,
- alternatively you can Save values from Plot-Profile and Color-Profile (of ImageJ), PasteSpecial/text in "raw" sheet from A9 cell and from C9 cell,
- check if your data fill completely in the yellow cells; instead of this, you can add or remove rows in the "raw" sheet and, of course, in the "calc" sheet,
- the only cells useful are the yellow ones, do not touch the others,
- do not touch the "calc" sheet, pass to "chart" sheet, please,
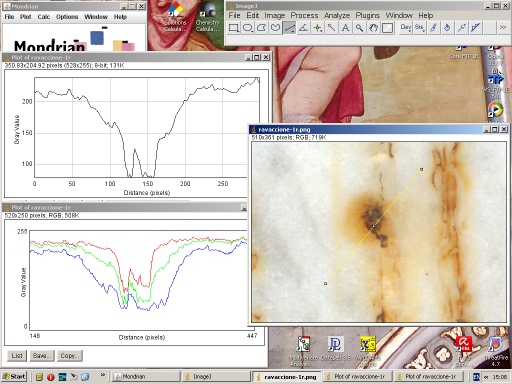 |
| Fig.3, the screenshot with the 2 plugin windows, click here to zoom image |
- you stay in the "chart" sheet, the scatterplot in A10 are the results of RGB profile %, in A38 the original values from ImageJ with also the B&W,
- if the chart is OK for you, you can copy the columns C, D, E from "calc" sheet with results in %,
- and, of course, copy the chart in A10 as reference,
- if you like to do a "white balance" in one point on the line you can use the cell D6 et D7 in "chart" sheet,
- writing 0 in the cell D6 disable the white balance correction, writing 1 in the same cell enable the correction, any other numbers produce an error,
- in the cell D7 it must be written the coordinate values for corrections (check the cells J7 and K7 for min/max values),
- as example, if you write 10 in D7 this coordinate on the line is corrected for white balance,
- the point n.10 have the three values of RGB corrected to 100% and all the other change in according,
- if you use the white balance correction the results columns will change,
- the new columns with results are the F, G, H, copy and remember to use PasteSpecial/Values in your new spreadsheet,
Examples
As an example I have produced the file GVisco_color-profile-example.zip with photo of samples.
A photo of marble Ravaccione is presented here, in the file, with the 2 profiles saved in .tsv format. This is the example already fitted in the main spreadsheet and it is shown in Fig.1 and Fig.3. (.tsv = tab separate values)
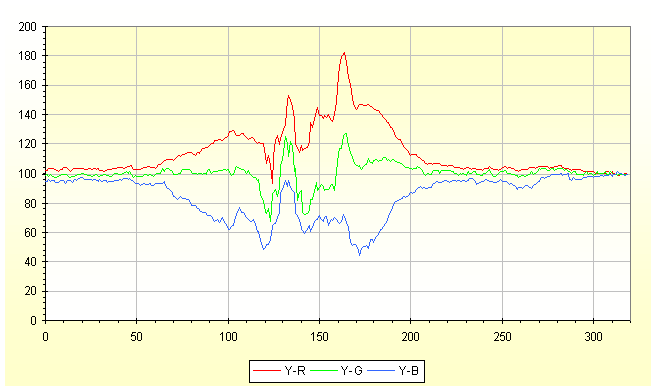 |
| Fig.4, result chart produced by our software for the sample of Fig.1, with white balance |
In Fig.4 above the elaboration of the stain on Ravaccione's marble as described before and using our software. It was applied also the white balance looking for a pure white point across the line. The data elaboration of our software permites an easy comparison of the masks and/or better comparison between 2 different cleaning methods.
In the file is presented the photos of Fig.2, as working example. It is a margin of a paper of XVII seculum, the file margin-1r.png is the stain as-is, the following show 2 cleaning methods. Also, in the file, there are the B&W profile and RGB profile already computed with the plugins. The '1r' is the original one, the '3r' photo is passed with cleaning method B, and after that, on the same sample passed a different cleaning method A obtaining the '2r' photo. You can use it to check the capability of this software to show the difference among the 3 surfaces. In the .zip file there are the 3 profiles solutions for margin-xx photo. Please find your better cleaning method.
To sum up, there are present the photo of marble Calocara and one margin of an ancient paper dating 1808.
Tips
If you know Excel you can expand or reduce the 320 rows, or the 500 rows, and probably can design a better solution.
Donations if you have a Bitcoin wallet
If you have a nice fat wallet you can send a few cents to this code 1ETv1mJTZTB7EiXwZkucF2BTA512Rkaw6 maybe with a message (be careful to the transaction cost, send 0.1 and pay 0.01 is not a good idea).
1ETv1mJTZTB7EiXwZkucF2BTA512Rkaw6 <== my code , Thank you.
Donations if you have not a Bitcoin wallet
If you like this work and measures you can make a small donation of Bitcoin. You do not need a wallet to make a donation, indeed even those who have Bitcoin wallet is better to pass for a web site that "gift" currency since this does not have a transaction cost.
To make a donation you must use some of your web-time. Go to www.GreenBitCo.in, enter my code 1ETv1mJTZTB7EiXwZkucF2BTA512Rkaw6 enter the Captcha code that you see, press "Claim Now" button. Wait 15 minutes on the publicity page, when the 15 minutes pass fill the new Captcha and press "Claim Now" again. To get some value are necessary 10 pages or more. Be careful, do not use roulette, dices, casino and other stealing web site.
1ETv1mJTZTB7EiXwZkucF2BTA512Rkaw6 <== my code , Thank you.
Universita' Degli Studi di Roma
La Sapienza |
Dr. G. Visco
appointed professor for chemometrics & .... |
Corso di Laurea in: Scienze Applicate ai Beni Culturali ed alla Diagnostica per la loro Conservazione |


Back Page
read help
C© Copyright
we did it